An overview of the Rust charting ecosystem
Over the past five years, modern data science tooling has significantly improved thanks to modern tools that expose a performant core with ergonomic Python bindings built around modern standards like Parquet and Arrow. My typical workflow now starts with uv and uses Polars for data manipulation. This has been very nice and is widely adopted.
However, charting still lags. I’ve never found a charting library I like. The options are:
| Library | API ergonomics (my preference) | Polars compatibility | Speed | Other |
|---|---|---|---|---|
| MatPlotLib | Bad | Not compatible | Fine | |
| Seaborns | Good | Not fully compatible | Slow | Struggles with large datasets |
| Plotly | Good | Not fully Polars-compatible | Very slow | |
| Altair | Ok | Compatible and endorsed | Fine | Have found API and docs unstable |
Given this landscape analysis, I think there’s opportunity for a new charting library with an ergonomic API, tight integration with Polars, and fast performance.
The current state of Rust charting
The Rust charting ecosystem has lagged. The most mature project is Plotters. While mature, it is very low-level and has no Python bindings. It is also no longer under active development although there is some discussion of reviving it.
But in the past few months, two authors have published new charting libraries that seem comprehensive and promising: Kuva and Charton. Both appear to be solo projects accelerated by AI. I wanted to play around with the APIs as well as compare performance between the new libraries, Plotters, and the Python-ecosystem packages.
Benchmarking
Setup and suiteCopy link
All benchmarks were run on an M4 Macbook Pro with an M4 Pro (12 core), 24GB of memory, and Mac OS Sequoia 15.3.1. Python benchmarks were run with Python 3.14 (uv-managed) and Rust 1.95.0. Source available on Github.
The dataset is based on September 2025 Citibike rides, synthetically amplified to reach large scales. The export target is PNG.
To stretch the libraries, I tested benchmarks on very large datasets:
- Line chart, total rides per minute: 85k, 175k, and 850k datapoints
- Scatter chart, ride duration vs. distance traveled: 500k, and 5m datapoints
- Histogram, ride duration: 1m and 10m datapoints
I also tested smaller datasets that would be more representative of most analytics use cases.
ResultsCopy link
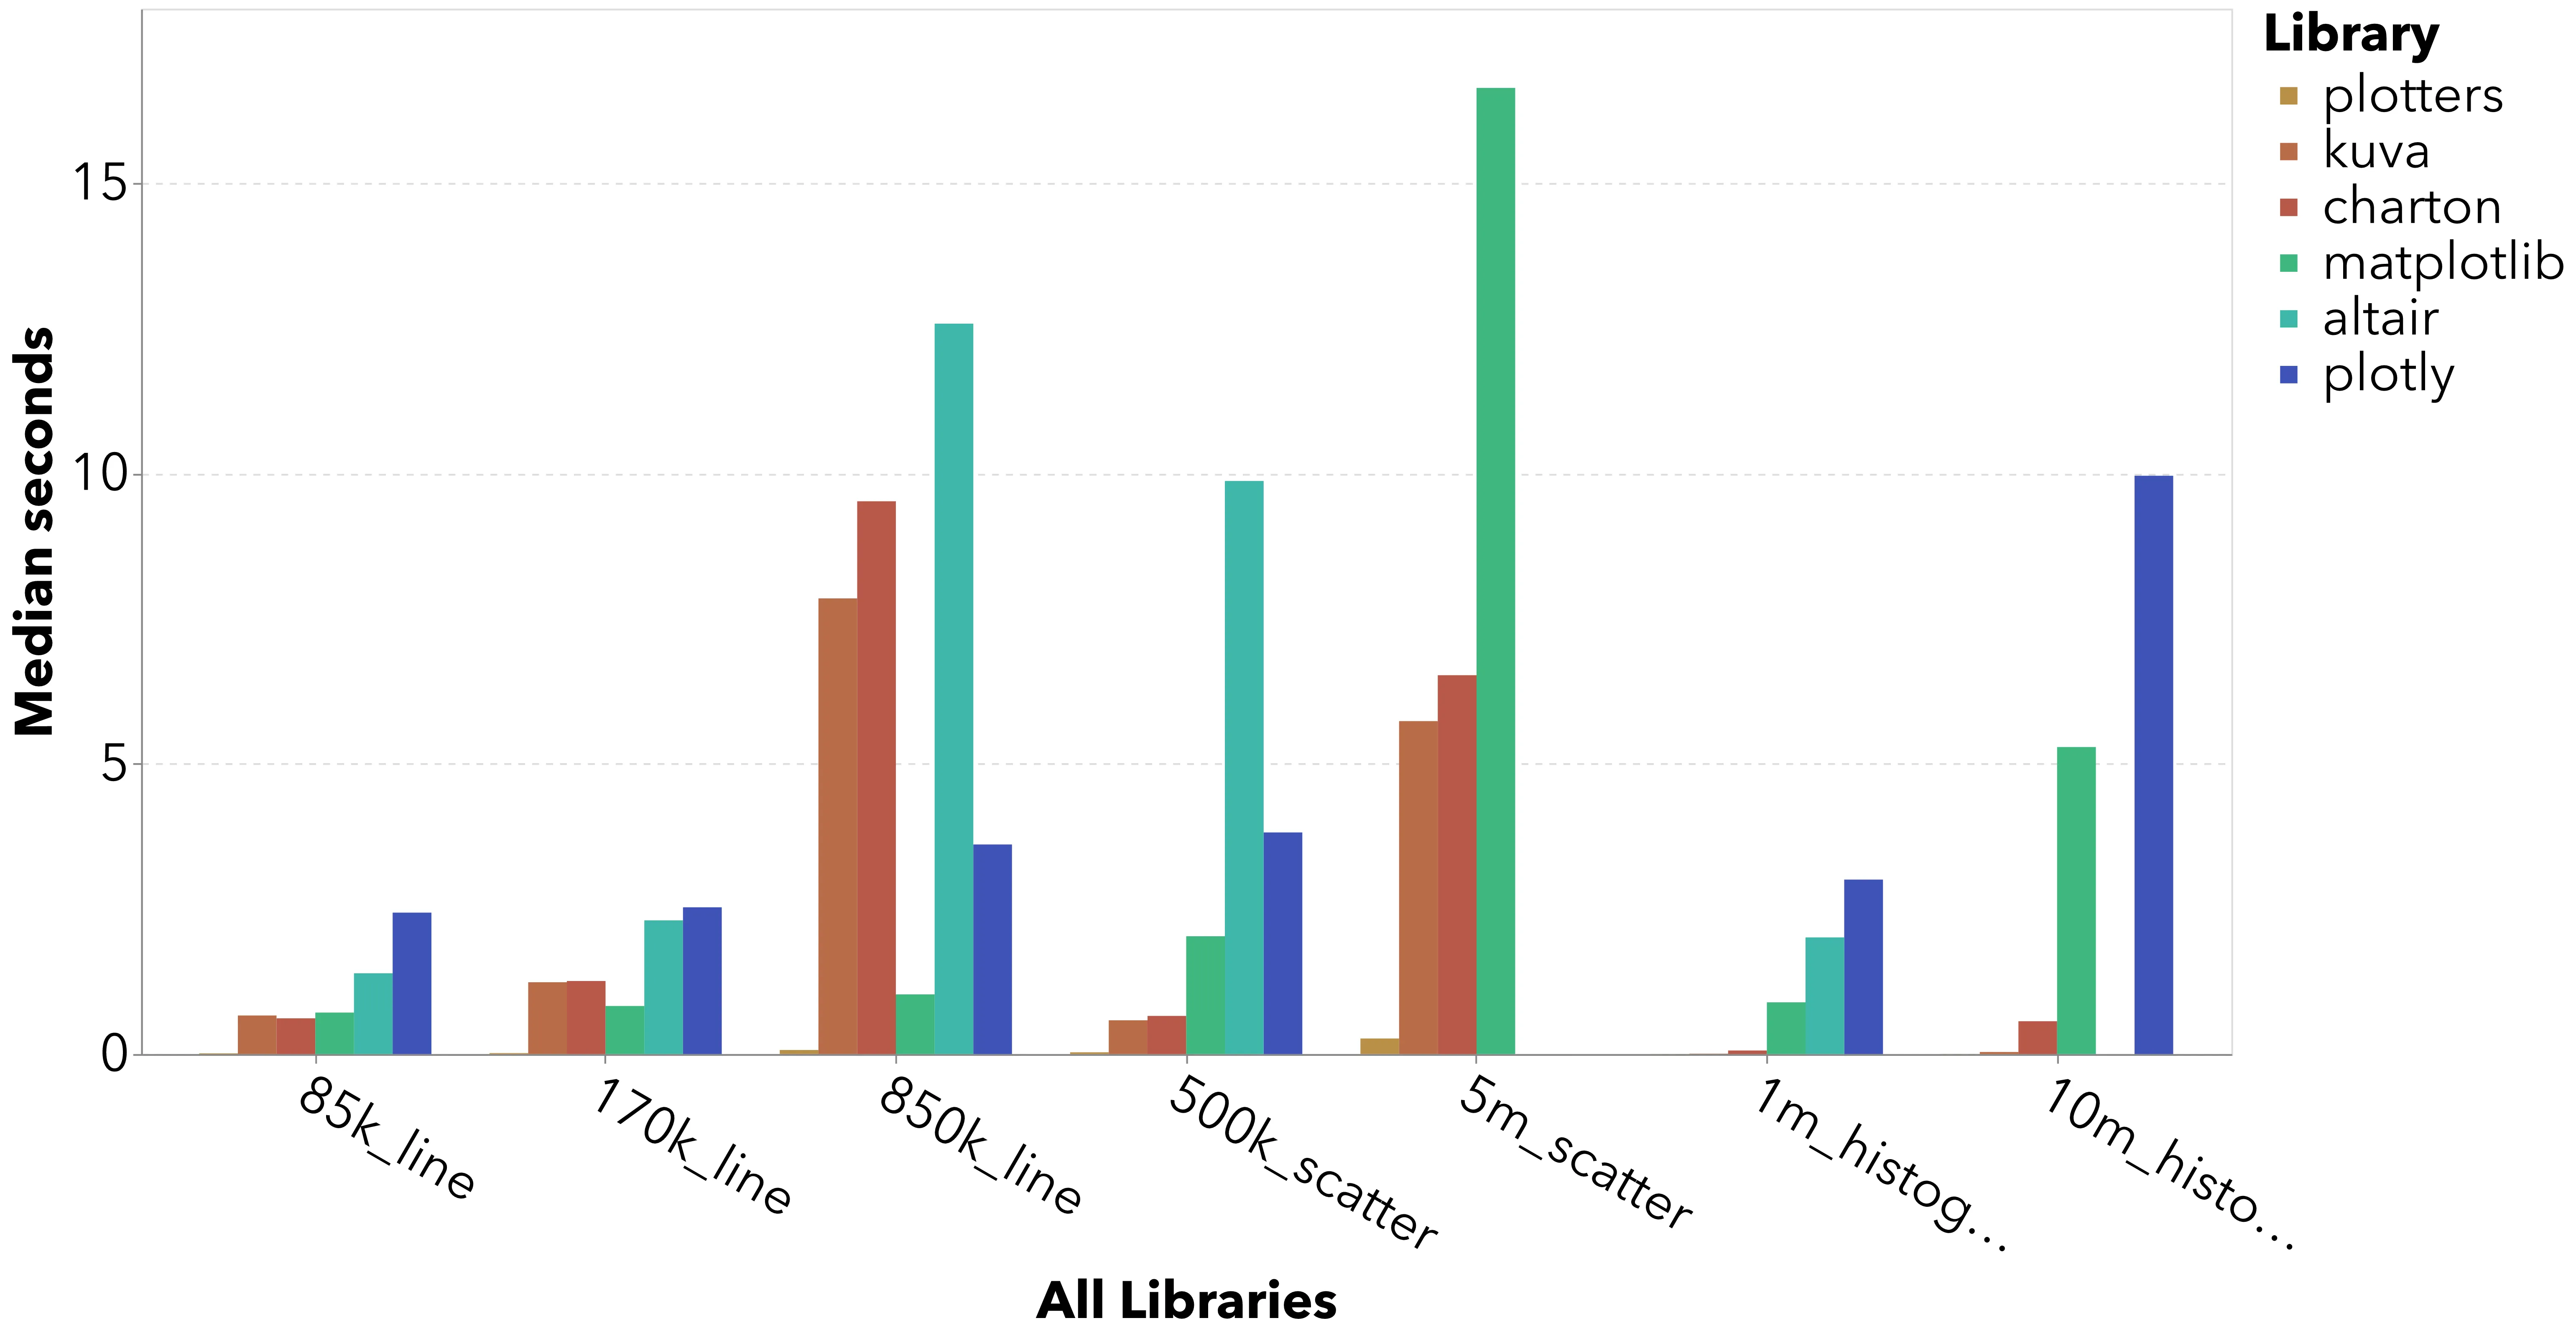
From a performance perspective, Plotters crushes every benchmark. Altair and Plotly come in last place in every benchmark and can’t even render large datasets like the 5m datapoint scatter plot or the 10m row histogram.
Kuva and Charton have inconsistent performance vs. Matplotlib: better performing for histograms but significantly worse performance for the 850k datapoint line chart. This is likely because PNG export in both libraries goes through a vector drawing step before being rasterized with the resvg crate. Both Kuva and Charton treat scientific publication as the primary use case, which apparently requires raster graphics.
As you can see, though, this is significantly slower than writing a bitmap directly. A Kuva contributor actually has an open PR for a direct raster backend, but some merge conflicts and other significant changes must still be resolved (and last progress was two months ago).
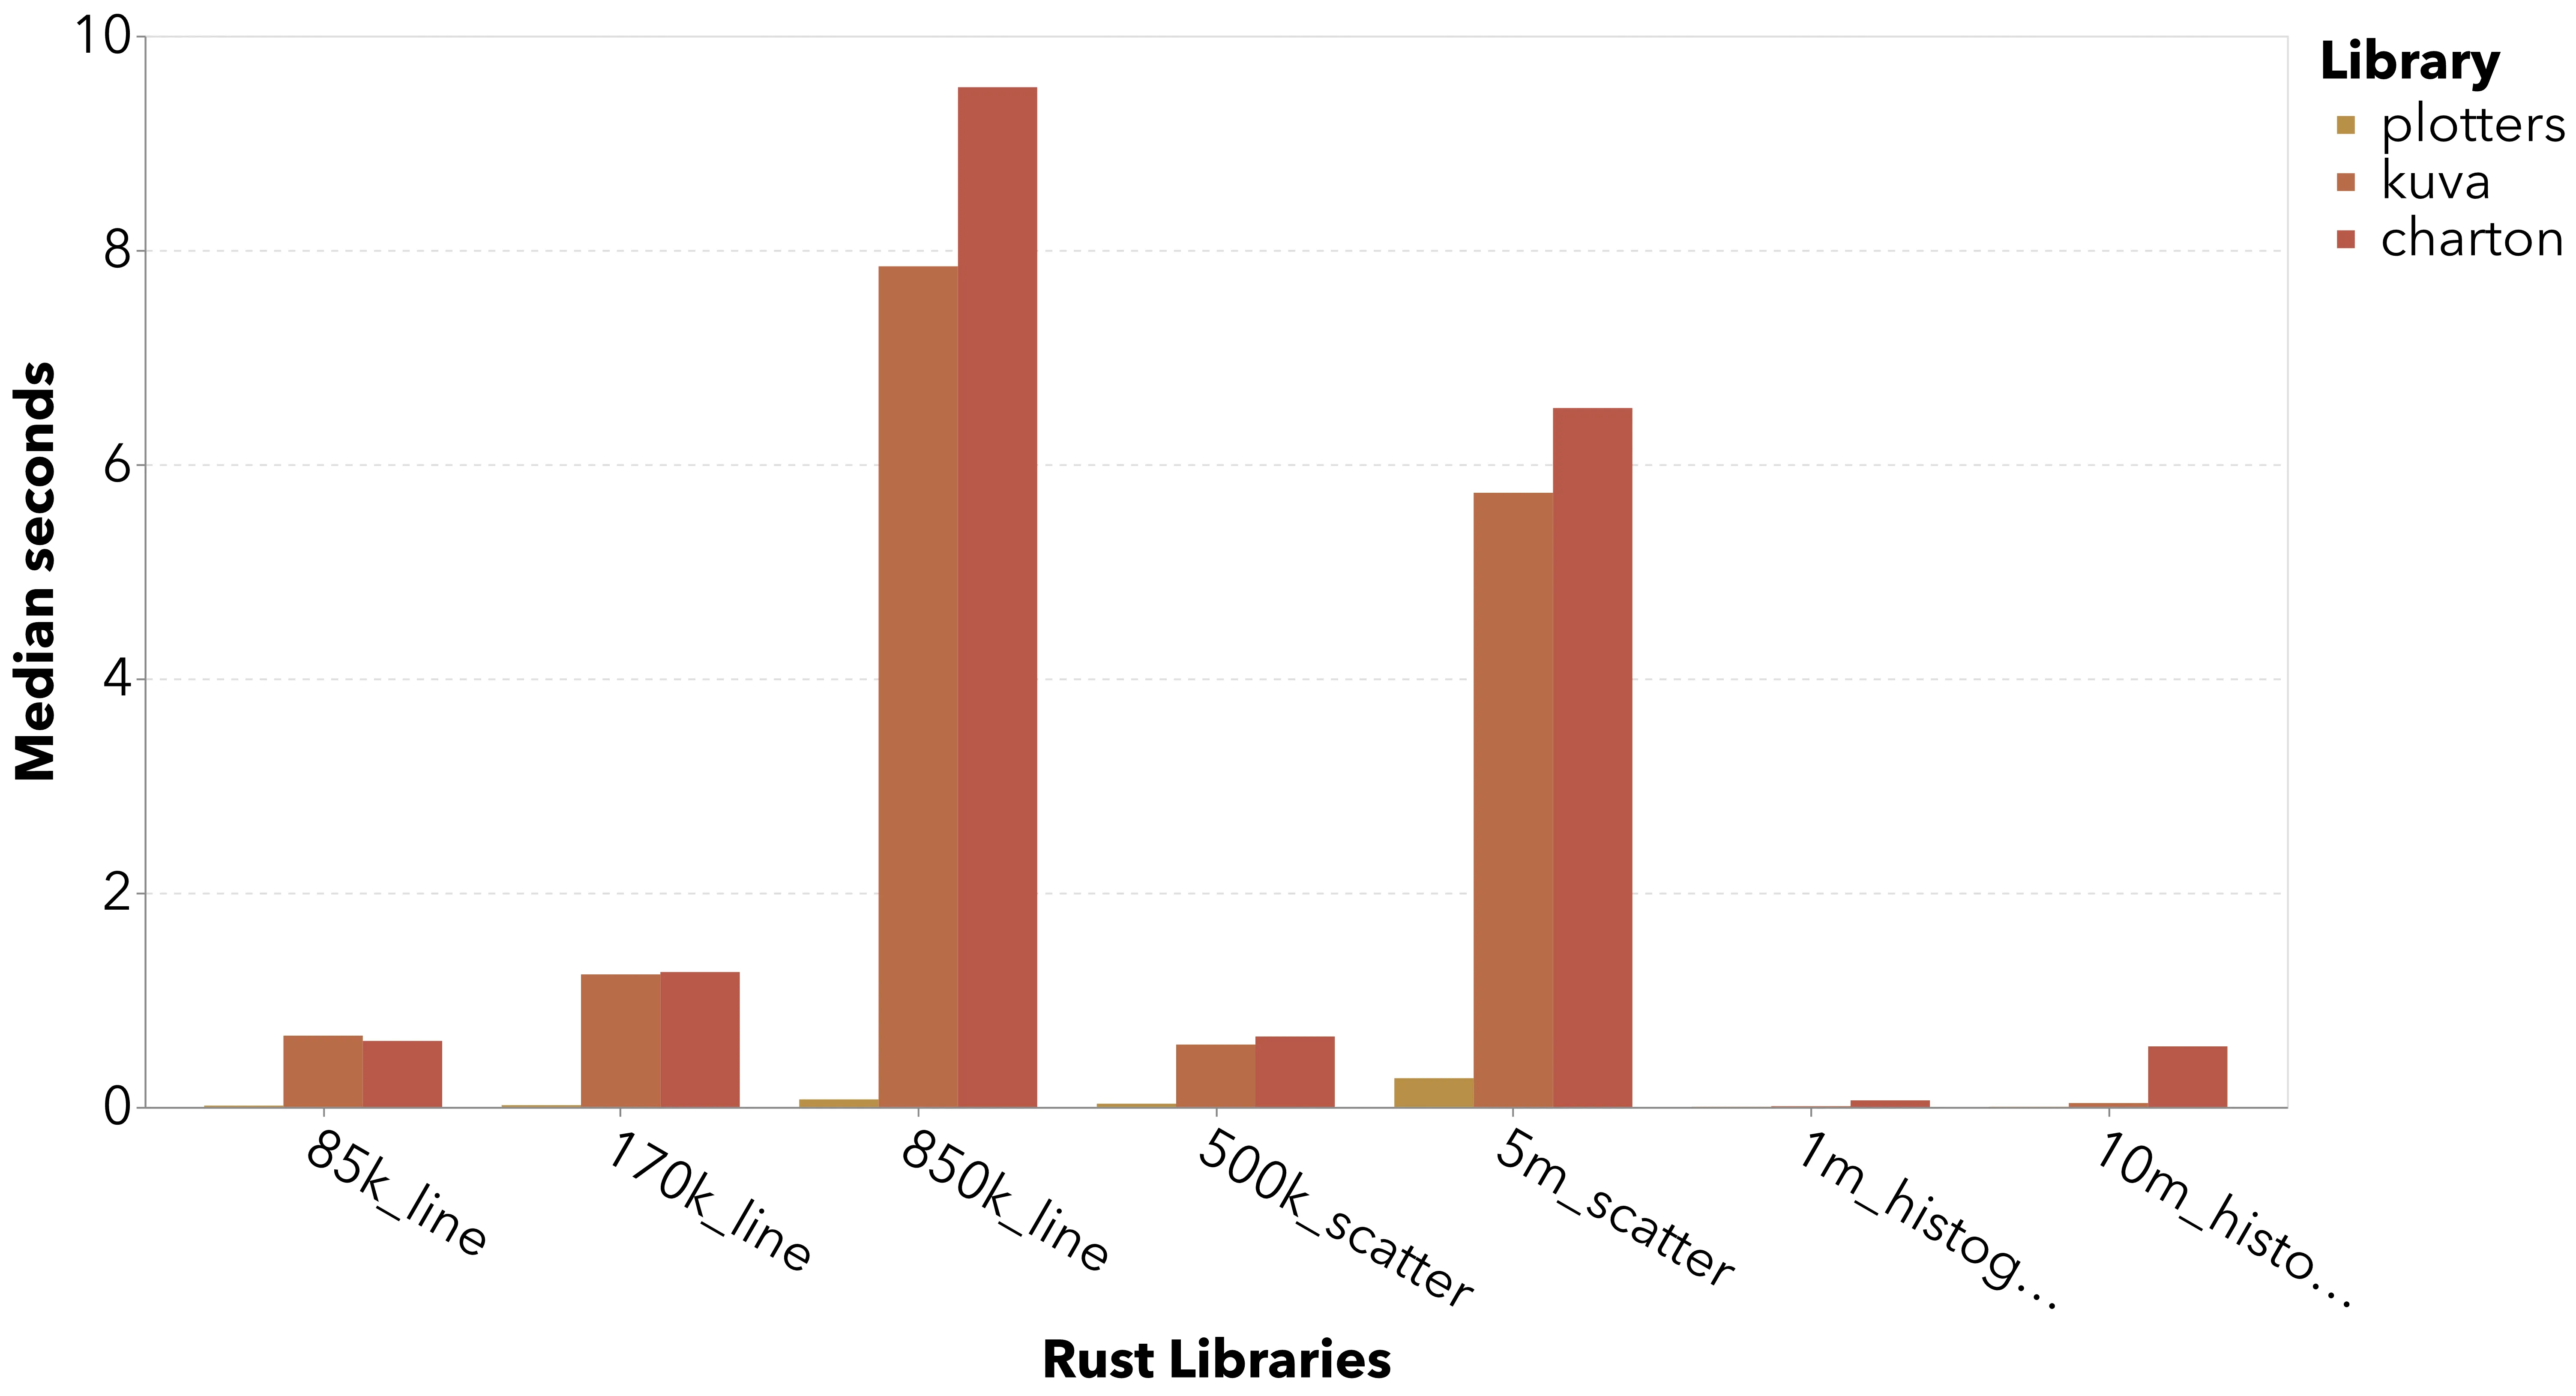
Filtering to the Rust libraries shows the significant performance difference between the SVG path and direct raster drawing.
On smaller datasets, the Rust libraries all perform very well vs. the Python incumbents.
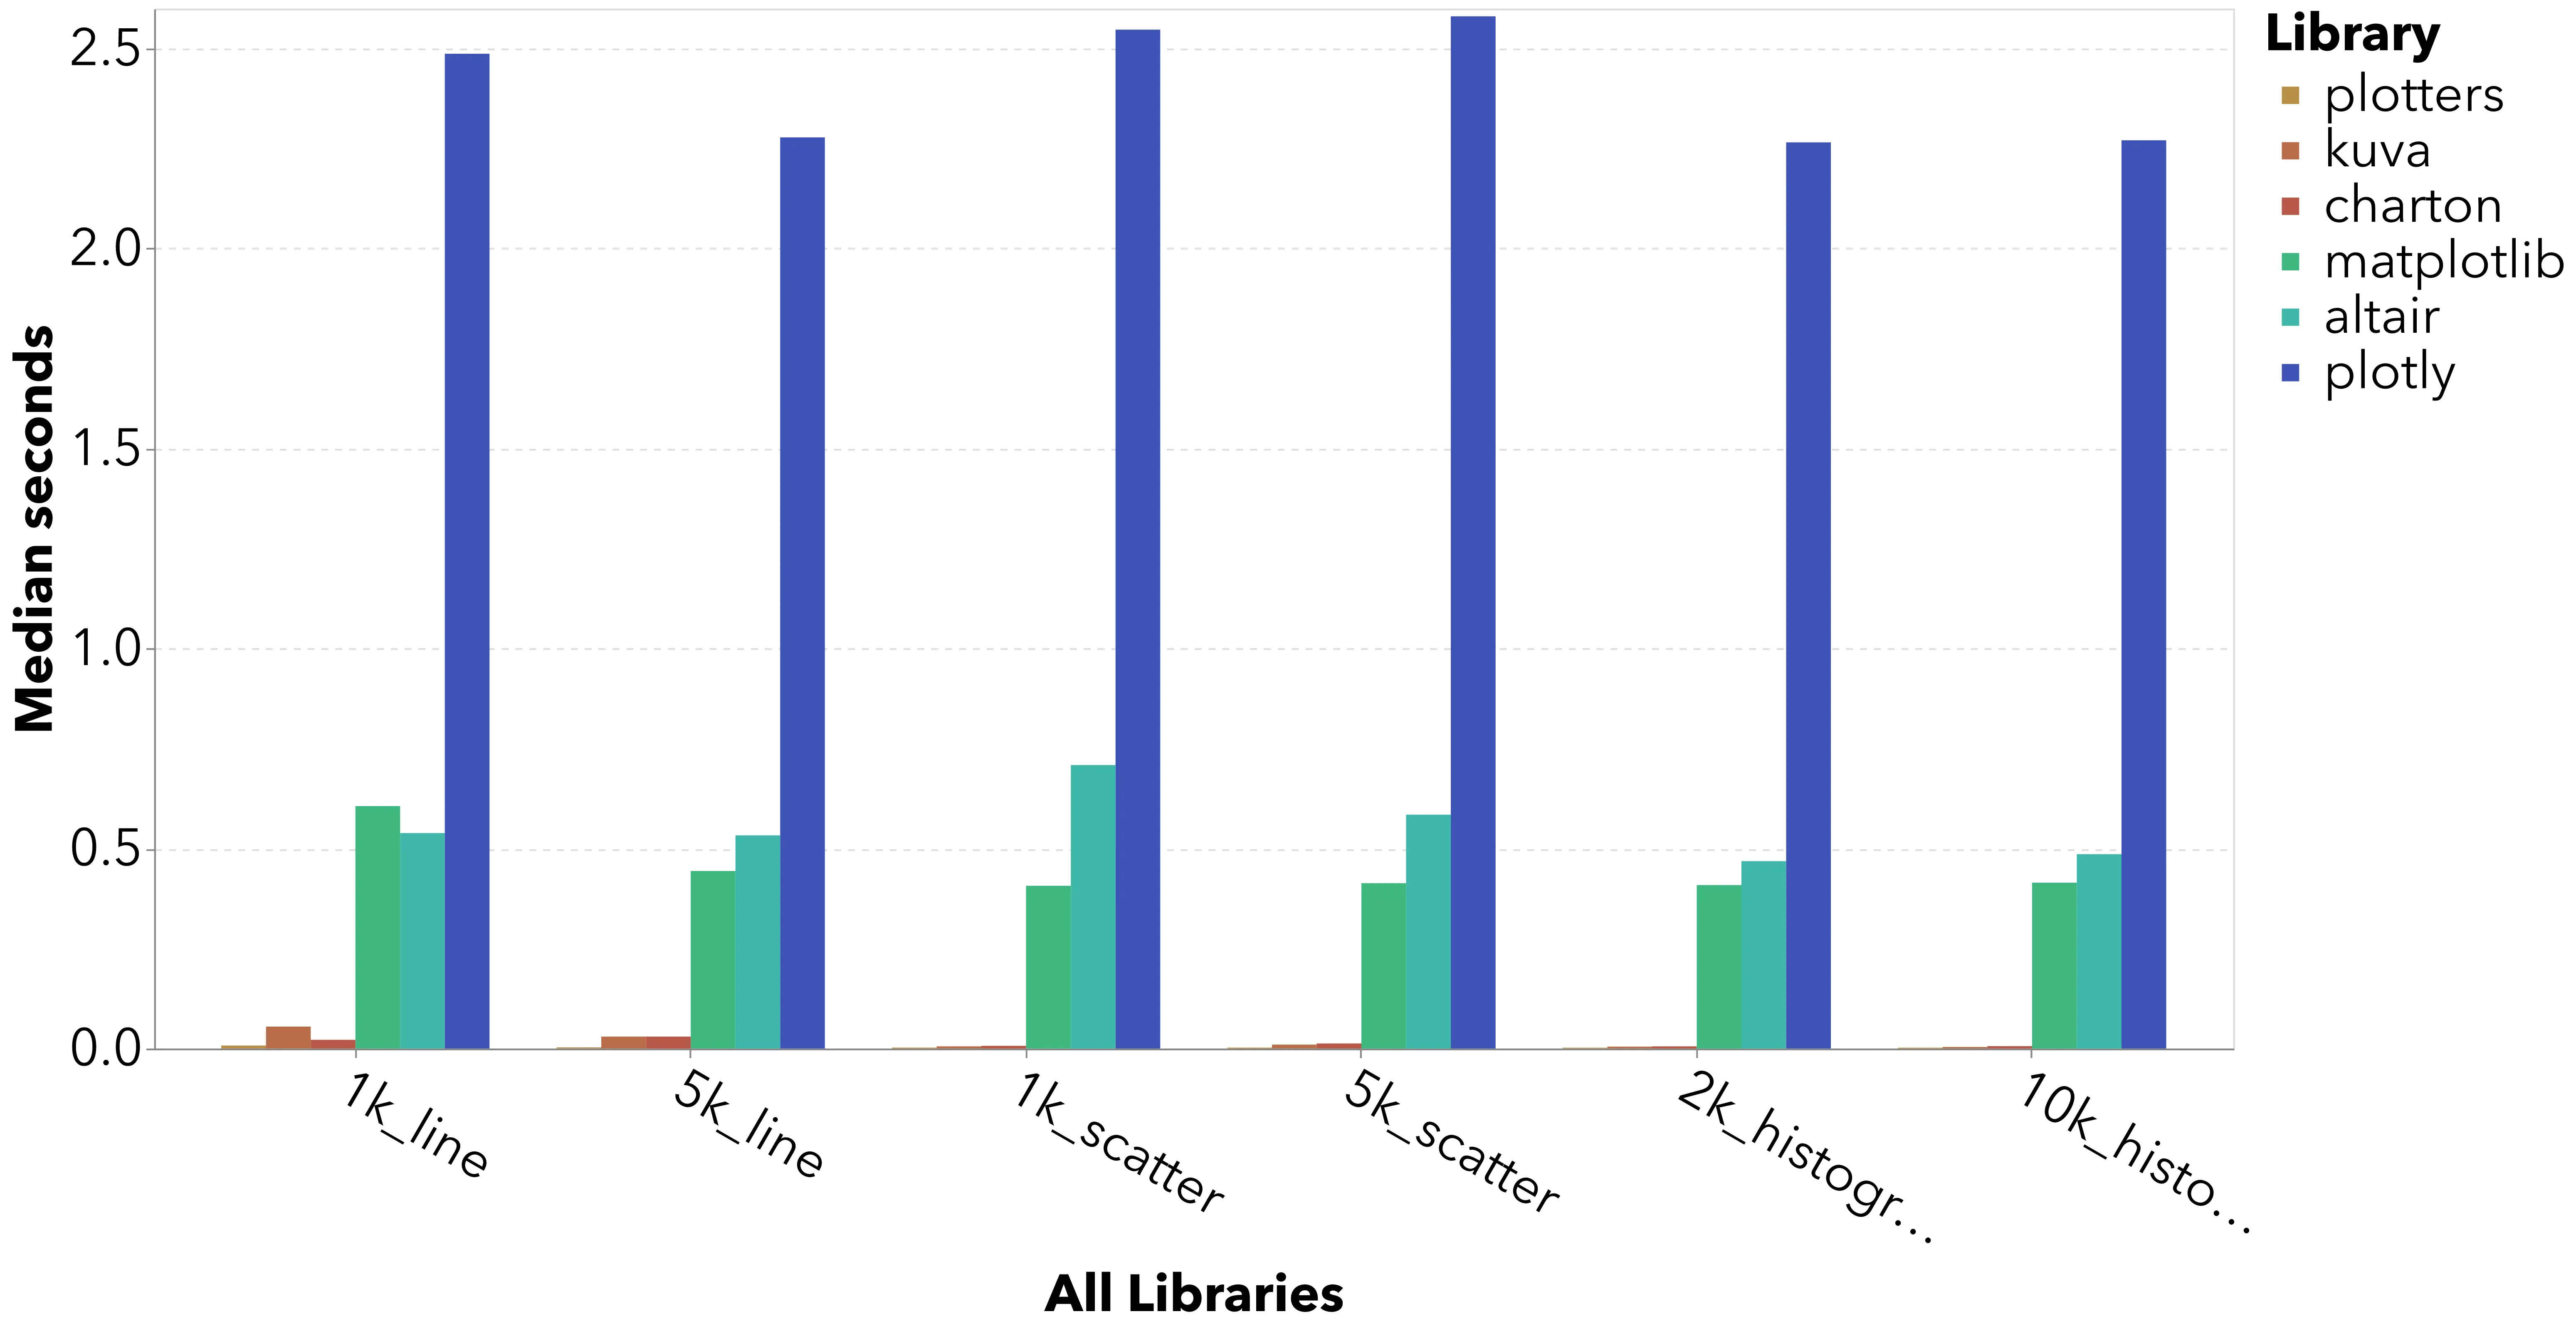
For typical data science use cases, there is absolutely space for a faster charting library! The Rust libraries render charts instantly while MPL and Altair still take half a second. Sounds small, but that is a meaningful UX difference.
There are large relative differences between each Rust library, but in absolute terms each library is lightning fast.
Speedups vs. MatplotlibCopy link
The lowest-hanging fruit for both Kuva and Charton appears to be implementing a direct rasterization backend. Both library architectures decouple backend from chart construcction, so they can maintain an excellent vector output flow while also improving performance for raster graphics users.
With its direct raster backend, Plotters offers a 10x - 100x speedup vs. Matplotlib.
| dataset | matplotlib | plotters | Plotters speedup |
|---|---|---|---|
| 85k_line | 0.690 | 0.014 | 48 |
| 170k_line | 0.790 | 0.016 | 49 |
| 850k_line | 0.992 | 0.070 | 14 |
| 500k_scatter | 1.981 | 0.031 | 64 |
| 5m_scatter | 16.353 | 0.271 | 60 |
| 1m_histogram | 0.856 | 0.002 | 374 |
| 10m_histogram | 5.249 | 0.002 | 2,251 |
On the small benchmarks, Kuva offers a similar speedup vs. Matplotlib, so the only thing holding it back is the rasterization overhead.
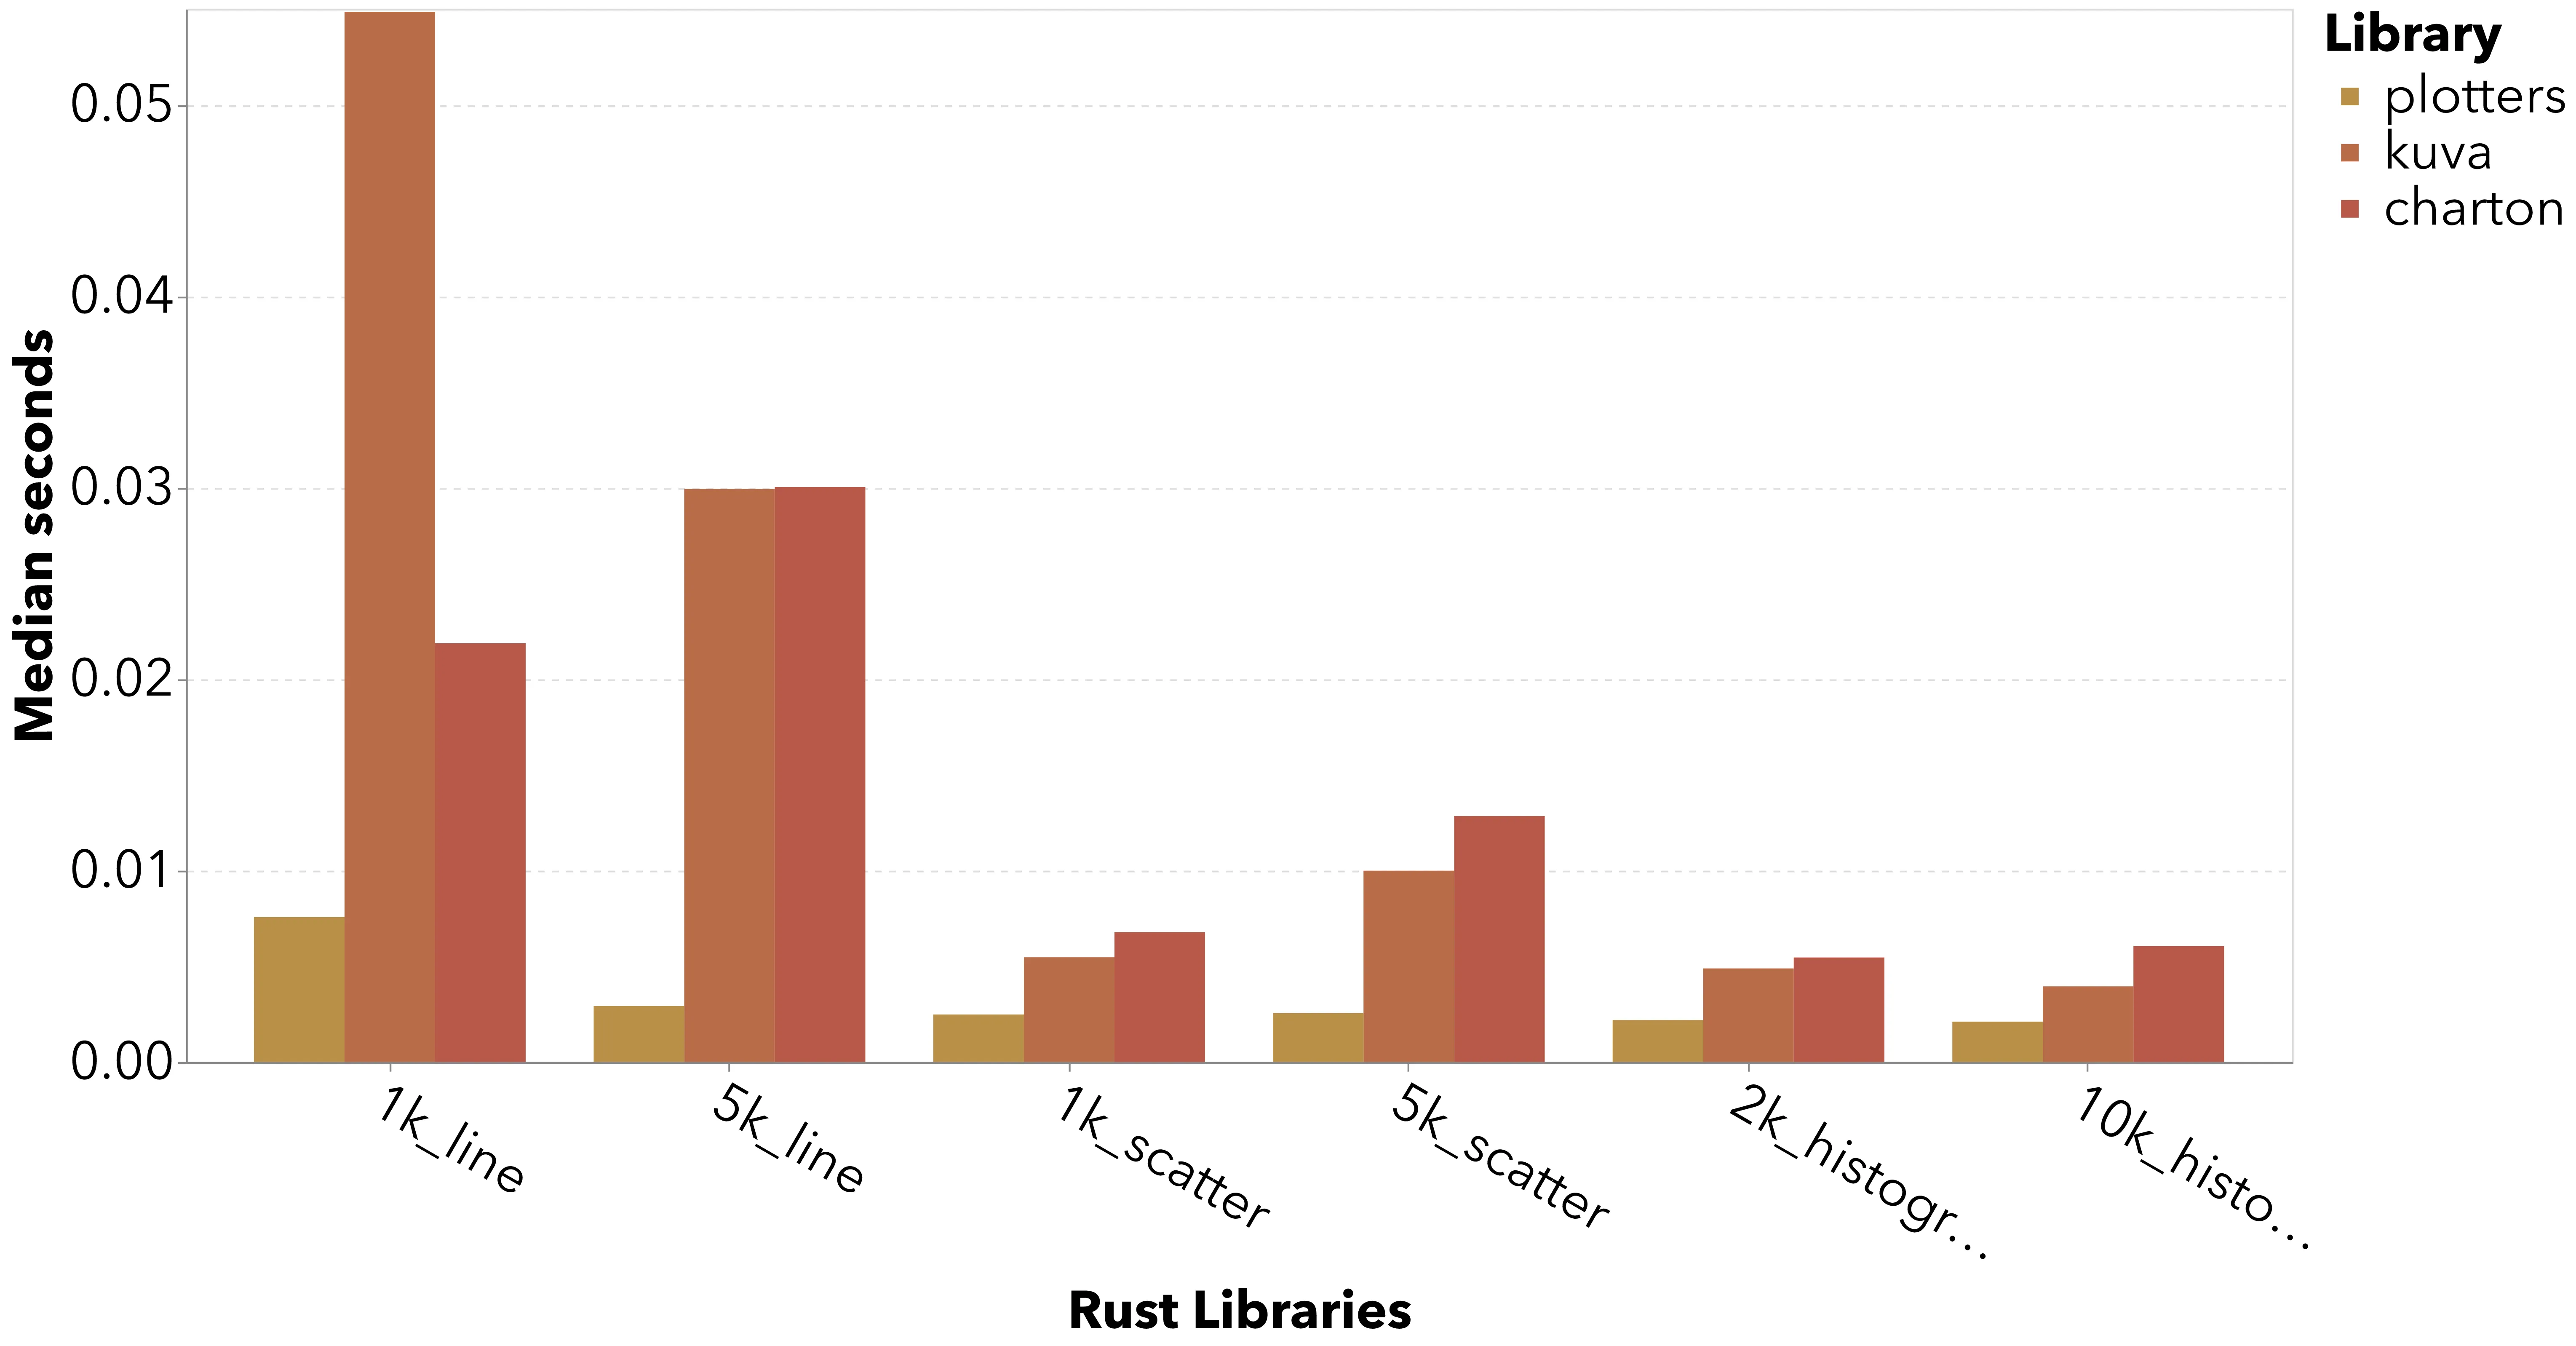
| Dataset | matplotlib | kuva | charton | Kuva speedup | Charton speedup |
|---|---|---|---|---|---|
| 1k_line | 0.606 | 0.055 | 0.026 | 11 | 24 |
| 5k_line | 0.444 | 0.030 | 0.042 | 15 | 11 |
| 1k_scatter | 0.407 | 0.005 | 0.019 | 74 | 21 |
| 5k_scatter | 0.413 | 0.010 | 0.038 | 41 | 11 |
| 2k_histogram | 0.409 | 0.005 | 0.016 | 84 | 26 |
| 10k_histogram | 0.415 | 0.004 | 0.015 | 105 | 27 |
Library ergonomics
The Rust libraries are diverse in their ergonomics.
Plotters is lowest-level and least opinionated. It doesn’t pre-defined chart types; instead, it provides primitives (line series, circles, chart/frame) on top of which you build your own chart. For example, to build a histogram, you calculate the x and y coordinates of each bin and draw them yourself. It’s hard to imagine using Plotters for everyday data science (plus it’s abandoned as a project), so I will not continue to discuss it.
Kuva and Charton are higher level and easier to use, but they still have significant differences.
Kuva expects input data as an (ordered) iterator of points. E.g., for a scatter plot or a line chart, you pass a (Vec<f64>, Vec<f64)>. In contrast, Charton was built with tight Polars integration in mind, so its core Dataset struct is structured as a set of columns with a schema.
// Kuva builds a scatter plot from Vec<ScatterPoint>
pub struct ScatterPoint {
    pub x: f64,
    pub y: f64,
    //..

// Charton's core data structure is table-like
pub struct Dataset {
    pub(crate) schema: AHashMap<String, usize>,
    pub(crate) columns: Vec<Arc<ColumnVector>>,
    pub(crate) row_count: usize,
}
Charton provides a convenience macro to transform a Polars dataframe into its Dataset type, and I think this would be an easy and useful feature for Kuva to add as well.
To configure charts, Kuva uses a builder API with sensible configuration names. You build charts, lay them out in a grid, and render as your final step.
let plot = ScatterPlot::new()
    .with_data(data)
    .with_color("steelblue")
    .with_size(5.0)
    .with_trend(TrendLine::Linear)
    .with_trend_color("crimson")
    .with_correlation();

let plots = vec![Plot::Scatter(plot)];
let layout = Layout::auto_from_plots(&plots)
    .with_title("Linear Trend Line")
    .with_x_label("X")
    .with_y_label("Y");

let svg = SvgBackend.render_scene(&render_multiple(plots, layout));
std::fs::write(format!("{OUT}/trend.svg"), svg).unwrap();
Charton is built around “the Grammar of Graphics” which seems like a pre-defined academic framework for defining charts in layers. If you’ve used Altair you will recognize the API. I gather the GoG is conceptually rigorous, but in my personal opinion, the result is that the API is hard to use. Skill issue?
Chart::build(ds)?
    .mark_point()?
    .encode((
        alt::x("wt"),
        alt::y("mpg"),
        alt::color("gear").with_scale(Scale::Discrete),
        alt::shape("gear").with_scale(Scale::Discrete),
        alt::size("mpg"),
    ))?
    .coord_flip()
    .configure_theme(|t| t.with_x_tick_label_angle(-45.0))
    .with_title("abc")
    .save("docs/src/images/scatter.svg")?;
Conclusion
Overall, the publication of Charton and Kuva are welcome and exciting developments in the world of data science tooling. While still very early, either library could expose a Python API and offer a significantly better overall experience for modern data science vs. existing Python libraries. This is the natural next step for the “oxidization” of the modern data science stack.
Strategic steps I would recommend would be:
- Support Pandas, but tightly integrate to Polars and/or DuckDB. A faster library is most likely to be adopted by people who have already demonstrated interest in faster tools.
- Add direct rasterization backend ASAP. Blocking rasterization on a vectorization path is a blocker to broader adoption and erases the “blink of an eye” experience for large datasets. Both librariers already have the right architecture, it just needs to be implemented.
- Focus on docs and DevEx as a key GTM lever. I’ve been using MPL more and more because I have to write less and less of it. MPL is deeply ingrained in LLM training data, so there is some incumbent advantage to overcome with good tooling. That said, GPT 5.4 was perfectly capable of writing my Kuva and Charton benchmarks, probably because they are open source (or becuase of the initial implementations I wrote). Both libraries do well by publishing copious examples; keeping these in-sync with API changes will be essential.